Index:
UPDATED ✅ Do you want to know how to calculate the statistical median of a spreadsheet in Excel? ⭐ ENTER HERE ⭐ and learn everything FROM ZERO!
It is no secret to anyone that, by default, Excel has been designated as the leading spreadsheet software used to carry out mathematical, statistical and financial tasks. Therefore, it is an essential tool for many students and professionals today.
In this sense, this program belonging to the Microsoft Office office suiteit is ideal for perform all kinds of numerical and mathematical operations, in a very simple and effective way. Since, it has endless functions that the users themselves can customize.
Thus, at a statistical level, Microsoft Excel has been cataloged as a very useful tool to carry out different investigations. Reason for which, allows to obtain the median of a set of data quickly and, in this post, we will teach you how can you calculate it.
What is the median and what is this value for in statistics?
Basically, in statistics, the median of a group of digits consists of that number or value that represents the average position of said set. That is, it is the central number of certain values that are arranged by size and therefore has fair half as many numbers with a higher value and half as many numbers with a lower value.
For its part, it is a data type that, in general, is denoted as “Me” and although it presents a certain similarity with the handling of the arithmetic mean, the truth is that both terms should not be confused. Well, while the latter is an average obtained from the relationship of all the numbers that make up a group, The median is simply the middle value of a data set..
Now, with respect to the specific use of this value in statistics, we distinguish that its main purpose is highlight the middle value of a rank order of numbers. Thus, its application is based on specify the number that is in the middle of a group of digits used for any study. Thus, for example, it is used to return the central tendency in the case of cross-sectional numerical distributions.
What should we keep in mind when trying to obtain a statistical median?

Although, using Microsoft Excel, the process of calculating the median of a set of values can be quite quick and easy to do, it is actually also it is worth taking into account certain general aspects when measuring a statistical median.
In this sense, to find out the central tendency of any group of numbers manually, it is important to understand that, these have to be ordered according to their size. In addition to this, if the total number of terms it’s eventhe two middle values must be added and divided by 2. Instead, if the number of digits is oddthe median will be that central value.
On the other hand, when this type of statistical operation is performed using Excelthe program takes into consideration certain parameters in order to let you know the specific value.
Next, We mention what these aspects are:
- In the event that the total of values that make up the set to be studied is even, the median will be obtained from the average of the central numbers.
- Regarding the arguments, they can be both numbers and also names, references or arrays that have some numerical data.
- If it is a reference or array argument and it contains text, empty cells or logical valuesMicrosoft Excel will ignore such information.
- Yes, within the table to study to calculate the median there are cells with the value zerothese will also be included during the calculation.
- without any exception, logical values and textual representations of data written in the list of arguments under study are always taken into accountdirectly.
- You need to know that if the arguments are text or error values that they cannot be translated into numbers by the same softwareerrors will automatically be generated in the final result.
Learn step by step how to calculate the median in your Excel documents
Finally, to know how to correctly use this spreadsheet program when perform operations such as computing the median of a set of data, it is important to detail step by step the process that must be executed. So then we proceed to make this explanation of great interest to many students and professionals from different areas:
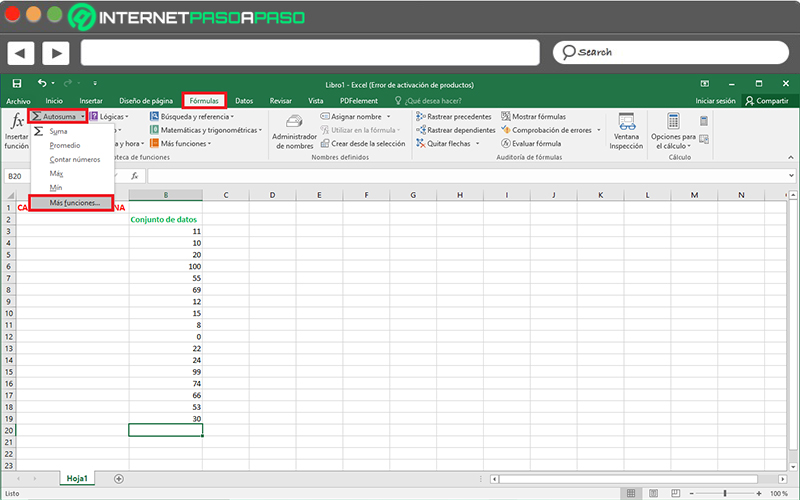
- First of all, proceed to open a blank Excel workbook or spreadsheet to add the group of numbers to which you have to calculate their statistical median.
- Once you include these digits in the form of a list, click inside any empty cell in the document (in this case, we place the cursor in the cell below the last number in the set).
- Followed by that, go to the program options bar (at the top) and click on the tab that says “Formulas”. There, in the Function Library group, press the “Autosum” option and select “More functions”.

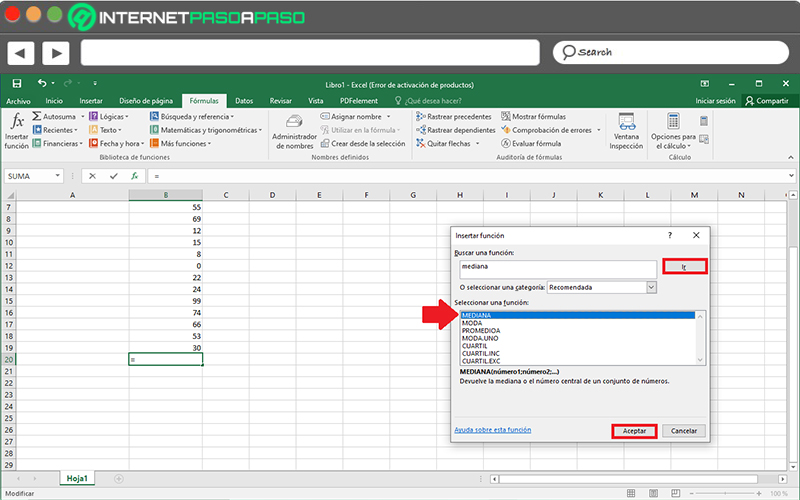
- Later, in the box that says “Search for a feature”you only have to choose type the term “median” and click “Go”. Once the software locates said function, Select it to click on the “Accept” button.

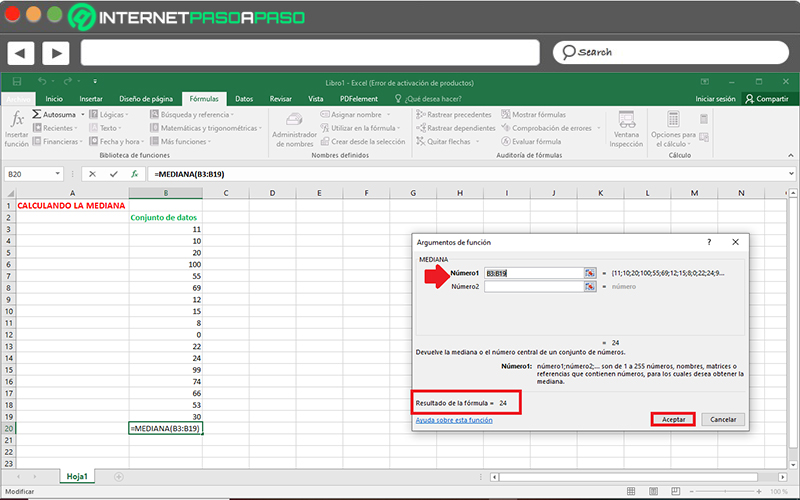
- Next, you must insert the identification of the first and the last cell corresponding to the list of your group of numbers. But generally, if you do this whole procedure with the cursor located in the cell after the last digit, the program will choose the list correctly on its own.
- When you verify that the numbers of said cells in the table are correct “number 1”click on the button “To accept” and immediately the result will be displayed in the indicated box of the spreadsheet (which, you can also view from this last dialog box).

In addition to this procedure, there is also another slightly more practical way to calculate the median of a group of data from Excel. A) Yes, the method is based on proceeding directly from the “Home” tab and in the Modify group, select the option that indicates “autosum”in order to carry out the same process detailed above.
Computing