Index:
UPDATED ✅ Do you need to know what are Chrome browser hidden pages to boost the browser? ⭐ ENTER HERE ⭐ and discover how to do it ✅ EASY and FAST ✅
Despite many years of using Google Chrome as our preferred browser, we still do not fully know its characteristics. But to cut it short, here we are going to comment on some other things that you should know about this browser.
We will show you all those hidden details and features that you don’t know about Google Chrome, from what they are, how they work and their differences. The proper use of these can allow us to greatly improve our browser.
If you are the most curious, first read carefully what we leave here, so that you do not run the risk of damaging your Chromethat surely if it happens, you will regret it.
What are the hidden pages of the Google Chrome browser and what are they for?
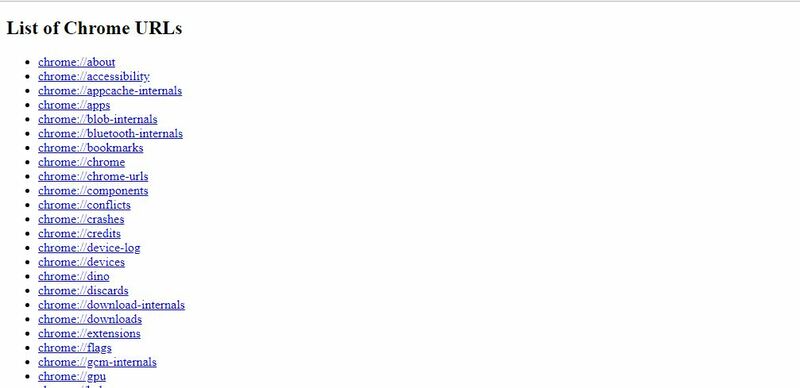
the hidden pages are those that allow us to perform browser settings. We can find them within the same browser, just by typing in the address bar “chrome://chrome-urls/” (without quotes) and will show us a list of more than 70 urls where we can access any of them to activate or deactivate functions, such as browser data, debugging tools and others.

There are other more interesting ways, such as writing in the address bar “://plugins/” and we will be shown 4 special browser plugins and the option to disable them, the plugins we are talking about are: Flash, Native Client, PDF Viewer, and Widevine Content Decryption Module.
Hidden pages and experimental features. Are they the same thing? differences
Experimental Features We Might Confuse Them With Hidden Pages, But They’re Actually Different. We could say that the experimental functions are those pages that allow us to access different options or functions that are being tested for the browser, but have not even been taken to its beta version.
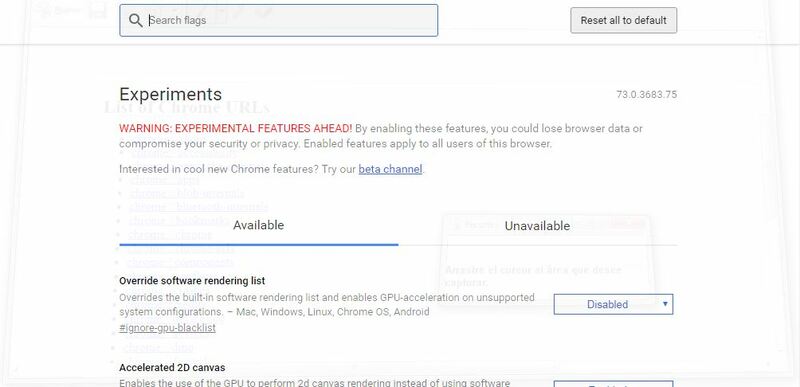
To access the internal functions we write in the address bar “Chrome://flags/” and from that we will get access to all the experiments of Google for Chrome, in other words; we will be able to access and activate all the new hidden functions for Chrome.
Although when we are going to activate it previously, the page warns us that our security and privacy may be compromised, make our browser unstable or directly lose the data that we have saved.

Now understanding what the experimental functions are, we can see their differences. Although if you haven’t noticed them yet, We are going to show you a small summary of their differences:
- Experimental features are new features that can be installed in the browser. Unlike the hidden pages, since they are functions that are already in Chrome.
- The experiments when activated can subject our browser to different privacy risks. Unlike in the hidden pages since they are previously installed in the browserThese do not subject us to any risk.
- Modifications made by hidden pages can be reversible, while many of the modifications made by the experimental functions may not be.
List of all hidden pages of Google Chrome and their functions
Now that you know exactly what Chrome’s hidden pages are and what they are used for, It is time for you to know each and every one of them below:
- chrome://accessibility – This function shows us information about the accessibility of each of the tabs that are open and if the function is active globally.
- chrome://appcache-internals – This function shows us information about appcached pages and the space they are occupying.
- chrome://apps/– From this we can see a list of all installed applications.
- chrome://blob-internals/– With this function we can obtain Information about Binary Large Objects (blobs).
- chrome://bookmarks– This address gives us the opportunity to manage bookmarks
- chrome://cache– Through this we see all the caches that exist in our browser.
- chrome://chrome/– There we will see all the information from Google
- chrome://chrome-urls– With it we can see the list of secret URLs of Chrome.
- chrome://components/– It shows us a list of components that Chrome has, and allows us to update them.
- chrome://conflicts/– With this address we can see all the modules loaded in the browser from the main process and it also includes all the registered modules.
- chrome://crashes/– This address shows us a report with specifications and details of the pages that close the browser.
- chrome://credits– This address shows us the usual credits of an application.
- chrome://device-log/– Through this address we will see the device logs.
- chrome://devices/– This shows us a list of all devices such as printers connected with Google Chrome
- chrome://discards/– We can see a list of tabs discarded during the session, these tabs are discarded when the RAM is not enough.
- chrome://dns– When prefetching is active, we can enter this address in the bar and it will show us all the information we need.
- chrome://downloads– With this address we can see all the history of downloads that we have made with the browser.
- chrome://extensions– It shows us all the extensions that we have installed.
- chrome://flags– We can see experimental functions and of all kinds that can be activated or deactivated from this page. It allows us to access experimental functions disabled by default.
- chrome://flash– It gives us detailed information about the Flash plugins integrated in Chrome.
- chrome://gcm-internals/– We can see information about Google Cloud Messaging.
- chrome://gpu– We can see all the information related to the graphics card, such as hardware acceleration.
- chrome://help/– We open the Google Chrome Information page. The version and the possibility to update are displayed here.
- chrome://histograms– Browser histograms.
- chrome://history– It opens the Chrome History manager where we can see all the web pages we have visited and if we want to delete it.
- chrome://indexeddb-internals/– We see IndexedDB information for the user profile.
- chrome://inspect– It gives us the option to inspect elements, pages or extensions.
- chrome://invalidations/– We see invalidation information.
- chrome://local-state/– It shows us a list of functions and whether or not they are activated in the local installation.
- chrome://media-internals – We see all the multimedia elements that we have played.
- chrome://nacl – Shows us information about Chrome’s NaCl plugins (Native Client)
- chrome://net-internals – It gives us detailed information about the network including SPDY connections or DNS lookups.
- chrome://network-error/– Shows network errors.
- chrome://network-errors/– Shows network errors.
- chrome://newtab – It opens a new tab.
- chrome://omnibox – We see everything about the Omnibox function and the possibility to change some parameters of the navigation bar.
- chrome://password-manager-internals/ – We see logs from the browser’s built-in password manager.
- chrome://plugins – It gives us a list of all the plugins and their status.
- chrome://policy – There we see all the policies activated in the browser such as the Password Protection Alert.
- chrome://predictors – Gives us a list of terms for autocompletion based on past activity.
- chrome://print – Page to print.
- chrome://profiler– Profile tracking information.
- chrome://quota-internals – We see information about the amount of space available for Google Chrome and the active profile.
- chrome://serviceworker-internals/ – We can see all the Service Workers registered by the browser.
- chrome://settings – The settings page opens.
- chrome://signin-internals – More information and statistics.
- chrome://suggestions/ – Suggestions.
- chrome://supervised-user-internals/— We see a list of active users and the possibility of testing filters by URL.
- chrome://sync-internals – Detailed information about the synchronization function is dictated.
- chrome://system/ – We see everything about the system with system diagnostic data.
- chrome://terms – We found the terms of service of Google Chrome.
- chrome://thumbnails/ – We are shown the thumbnails stored for the most visited web pages.
- chrome://tracing – By activating the Record option, the browser will begin to collect all the data of the activities that we have carried out.
- chrome://translate-internals/ – Information about the translation function integrated in the browser.
- chrome;//usb-internals – We see the possibility to test connected USB devices.
- chrome://user-actions/ – We are shown a list of actions carried out by the user, such as closing tabs.
- chrome://version – There we find information about the version of Chrome, operating system, JavaScript, Flash, command lines, etc.
- chrome://view-http-cache – Cached pages.
- chrome://webrtc-internals/ – Create a dump of the PeerConnection.
- chrome://webrtc-logs/ – Captured WebRTC logs.
These are not all that exist, we can also find others, which Google does not link directly as they can block the browser or close it. Except for quit or restart, the others are for developers to test different states of the browser.
Here are the Chrome URLs:
- chrome://badcastcrash
- chrome://crash
- chrome://crashdump
- chrome://kill
- chrome://hang
- chrome://shorthang
- chrome://gpuclean
- chrome://gpucrash
- chrome://gpuhang
- chrome://memory-exhaust
- chrome://ppapiflashcrash
- chrome://ppapiflashhang
- chrome://quit/
- chrome://restart/
browsers