
Index:
UPDATED ✅ Do you want to know the best online tools to create a 100% effective professional infographic? ⭐ ENTER HERE ⭐ and learn what they are
Infographics have become one of the easiest ways to explain a text visually with the objective of communicate specific information. In them you can combine what are texts and images in order to be able to do that the contents are much more attractive.
Therefore, in this type of tool the user can include text, illustrations, graphics, photos, among other elements that will help you achieve the public can understand and interpret all the information reflected there correctly. With all these elements, the reader can be further helped to understand all the information in instant form.
This is a tool that is widely used today by a large number of professional and university at the moment of wanting transmit any information or data. That is why you can currently get different websites capable of create professional infographics in an easy and fast way. In this way, here we teach you what are the best websites to carry this out.
List of the best online tools to create professional infographics
Taking into account that are infographics and their main functionhere we are going to teach you what are the main web pages where can you create them professionally. These types of website They have become the right hand of many professionals and students you constantly have to search Different alternatives to disclose specific information.
According to all this, here we will show you a list with the best online tools so you can start using them at home and so on elaborate each of your projects in a simpler and faster way, To do this, follow each of the websites that we will show you below:
canva.com
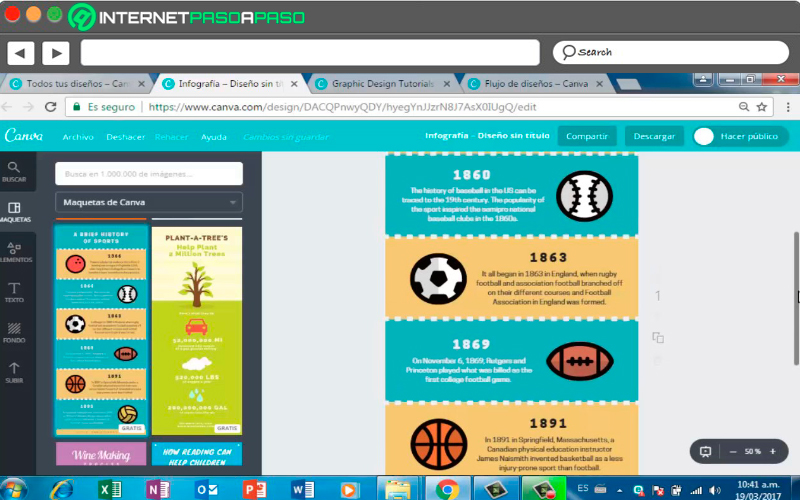
Currently canvas is one of the best web portals not only to perform infographics, but also for create logos and a large number of other tools that can be made from there. So this has become one of best online tools so much for children, youth and adults where they can carry out a large number of activities.
From here you will be able to different types of infographics where you will find different graphic elements and templates So you can choose your presentation. Despite being a free toolalso offers the possibility for its users to perform purchases of advanced elements or templates that allow them to obtain a much more professional result. It is available for both computers, tablets and smartphones.
All this has led it to become a perfect solution for make these kinds of presentations. where you will not require advanced knowledge to be able to work on it. Finally, it is important to mention that here you will also find templates for Facebook covers, images for Pinterest and for Instagram stories.
Easel.ly
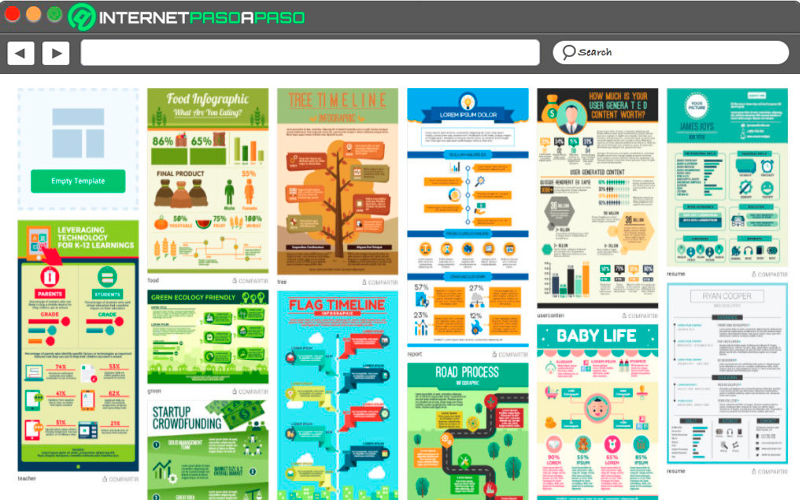
Another of the websites that you will find available today to carry out different submissions is Easel.lyconsidered one of the best portals for design infographics completely free. Here you can find a great number of templates of different types with which you can start from scratchsimply inserting the elements that you think convenient.
In this way, you can add as many images, graphs, figures, change the font, colors, modify the background of the presentation, among many other elements that you can handle. Your users can also share each of your creations once finished through their social networks.
It is important to mention that you will also find a PRO paid versionwhere you can find a higher number of templates that will help you create infographics much more professional. All this for just one price of 3.29 euros per monththus being one of the cheapest on the online market.
Visme.co
see me is another website that allows you make infographics and many others presentations for projects and papers. For this, it offers you a large number of templates available where you simply have to choose the one you like the most and fill it with the data you think necessaryeither by adding only text, text and images, graphics or any other type of element that is necessary.
It also has a online editor that will allow you to do many other activities from your website. Now, it is important to mention that see me has a free versiona Standard version with a price of 10 euros per month Y the Complete version for 17 euros per month. In the case of being a student you will get special prices.
Parchment.com
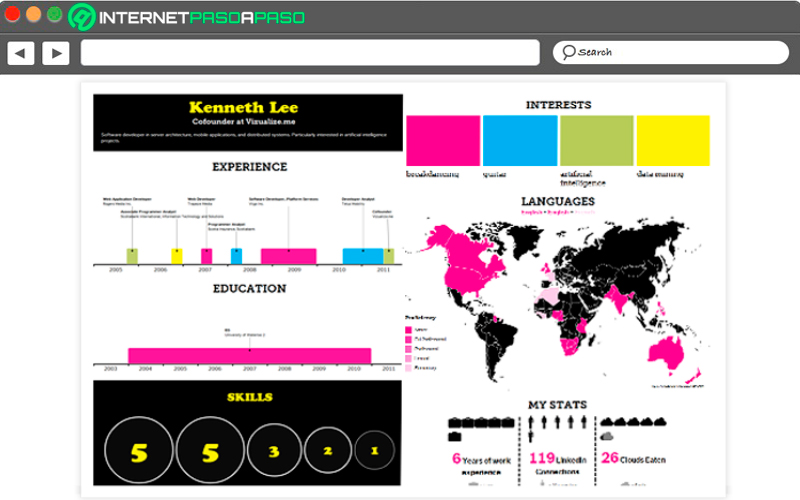
Visualize is one of the most used websites today, this is how it has over 8,000 active members among them educational institutions, businesses and many other organizations that depend on project presentations. This is how here you can find a large number of options when you have to design a presentation, including infographics.
Here you will not only have the opportunity to create these types of elements from scratch, but you can also turn your own resume into a very attractive infographic with which you can get excellent results. All this you can enjoy for free simply accessing the Visualize system.
ly
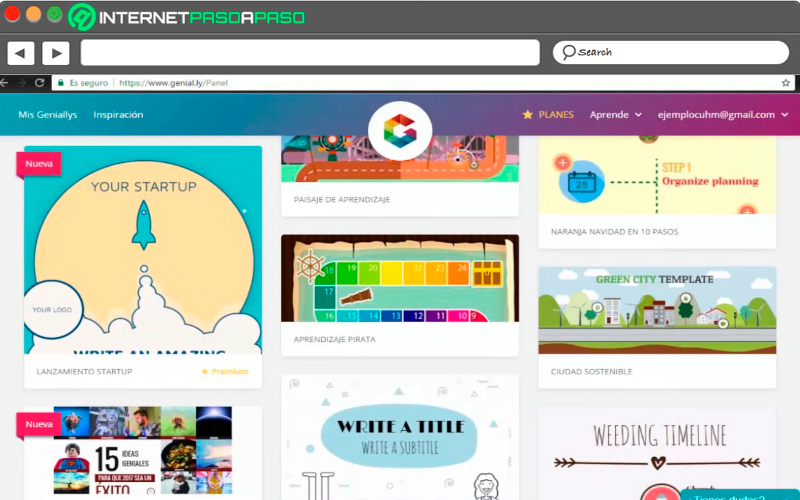
This platform has been developed by a group of spanish who have taken care of offer a very well-crafted platform where you can get all kinds of interactive content. Here you can make different types of presentations such as concept maps, slides, infographicsamong many others.
For this it has different templates Y chart types that will allow you to take carry out the designs that you want. For this it has the free version where you can enjoy a large number of items available, but if what you are looking for is something More professional then you can make the Master or Team version, both are paid and has a more options available. All these versions are designed to be used by professionals, teachers and students.
infogram.com
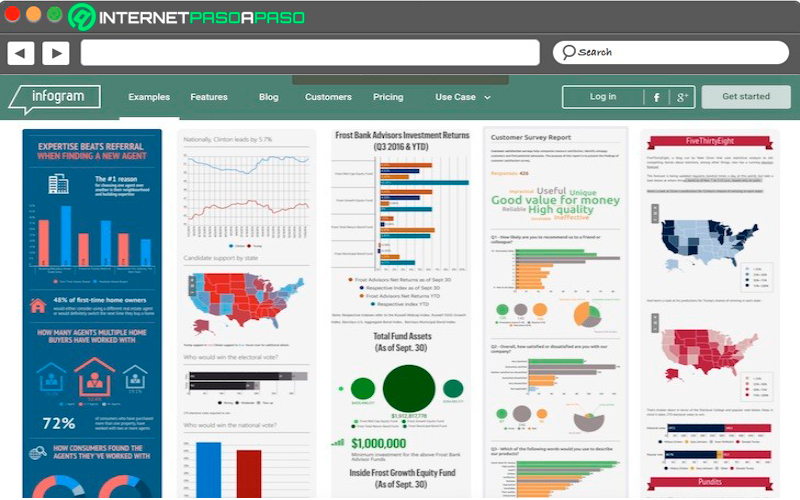
infographic Like the other websites that we have mentioned above, it has a free version and three more paid versionswhich are the PRO version, Business version and Team version, this being the most advanced and professional of all. However, in its free version you can find a large number of elements that will help you achieve very good results.
This is how your users can find different templates to perform each your presentationsincluding the infographics where can you add as many text boxes, maps, images, graphics, animated objects, videos, among many others. With all these details you can create very entertaining and easy to understand presentations.
One of the main characteristics of infographic is that completed projects you may download them to your computer or simply share them through your social networks either insert it into your own web page. Which becomes an ideal choice if you drive informative or educational accounts.
Piktochart.com
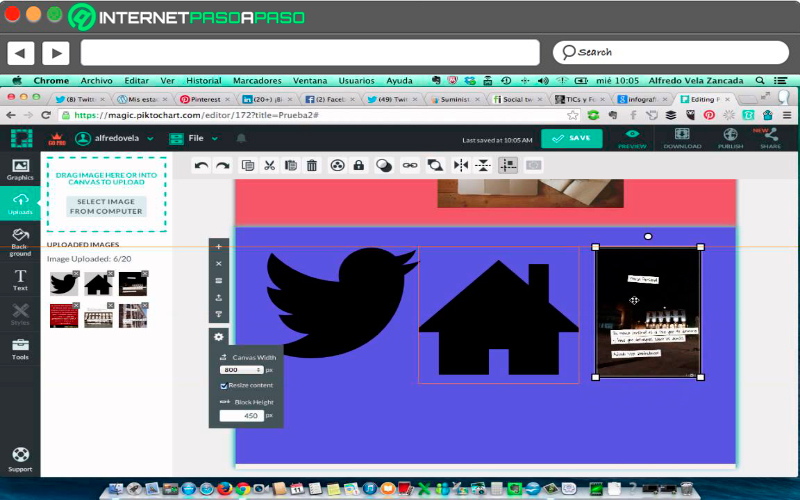
pictochart it’s a customizable editor that allows you to modify your different Projectseither changing the background colors, the font, you can add different basic shapes, graphics, add your own images or videos, among many others. It is mainly characterized by developing a large amount of completely free and very advanced infographics.
For this, it offers you different templates that you can manage and design them as you want, either dragging items to different placeschanging the frame size, imagesamong other. pictochart is not the exception and also has several paid versionsas it is the Lite, Pro and Pro Team version the latter being the most advanced of all.
Venngage.com
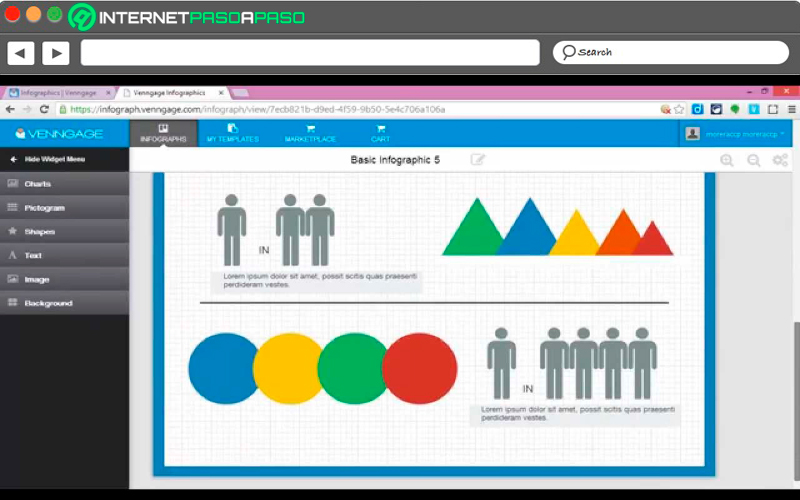
revenge is another of the web pages that you will find currently available for create free infographics. Here you will be able create your own custom slideshows or just make use of some of platform templates. One of the main features of the system is that it allows you to get followers who evaluate each of your worksthis will let you know the opinions of third parties in each of your works,
Here you can create presentations for later insert them in other web platforms or to add them in different online blog. An ideal portal for college youth They constantly have to be doing this type of activity.
developers.google.com/chart
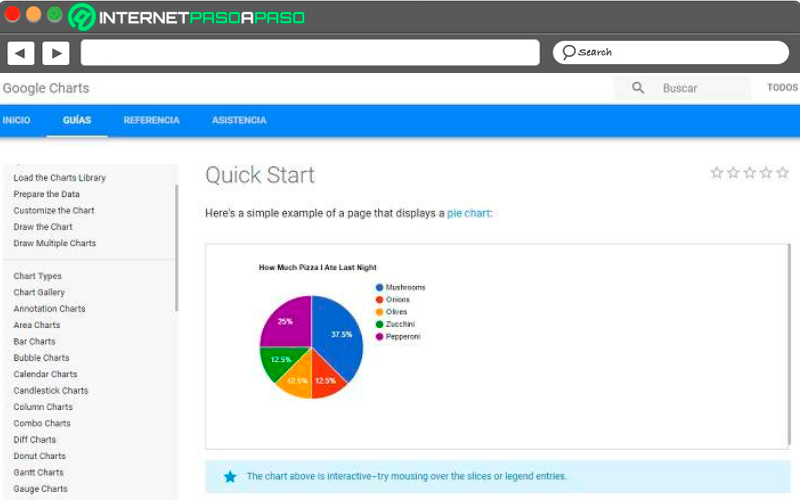
This is one of the most used tools today, it has been powered by google and allows you to create a large number of projects, charts, bar charts, slices, columns, calendars, among many others. All this has led him to become one of most searched sites for these types of activities.
So if you’re looking for a way to create infographics easilyhere you will find a great number of alternatives that will help you get professional resultsespecially to teach different types of information that contain numerical or statistical data.
iCharts.net
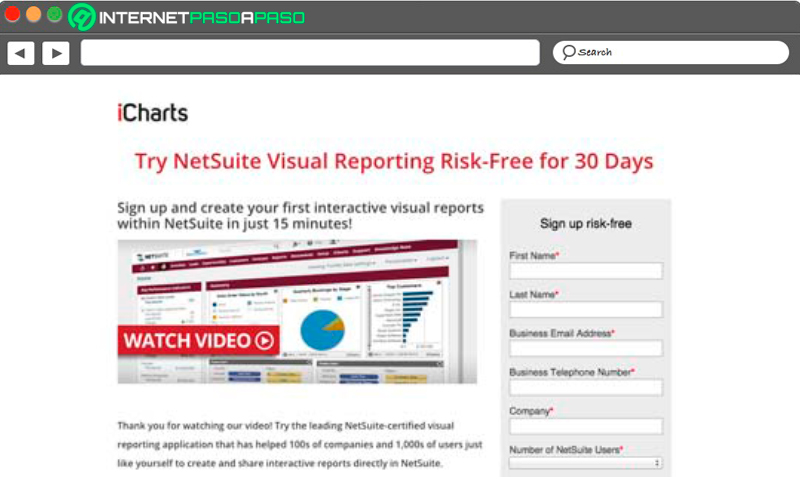
Finally, we present iCharts other of online platforms with which you can currently work at the time of create an infographic. This is how it also offers a great number of graphics and other elements that will help you create very complete and very good quality presentations.
iCharts is characterized by being a very simple program to handle, where it will show you a visualization of your work and once finished it allows you to share it with your friends and family in a very simple way. All this has made it a ideal platform for working with big and small data in a very easy and fast way.
7 Graphic Design Tips to Help You Create Better Infographics
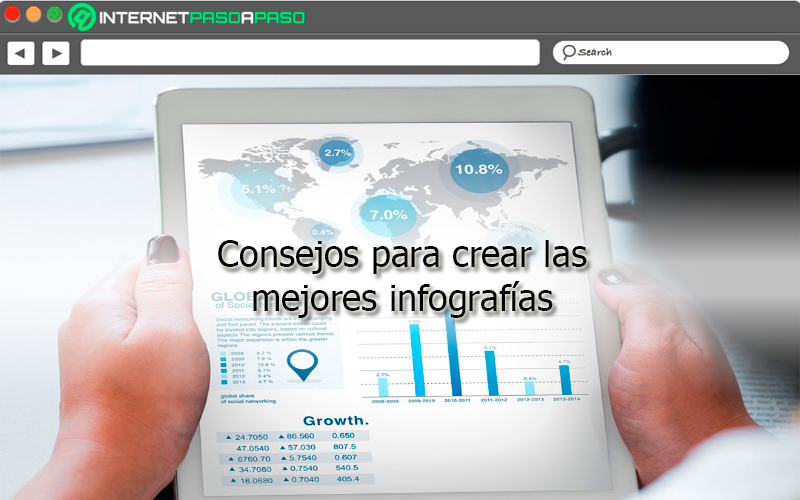
infographics have become one of the most important elements for what is web positioning and content marketing today. This is how this type of tool is becoming more and more common in social networks, blogs and web pages, where previously it was only handled in universities or labor offices.
And it is that these elements consisting of text, graphics, images and other objects have become a fundamental piece for convey specific information visually, with the purpose of correctly explain a specific topic. According to this, here we are going to give you 7 tips so you can start create your best infographics in a quick and easy way.
catchy title
The first point to note is titleIn this case it is very important that it contains a quite striking name be able to attract the reader’s attention. To do this you must include keywords and summarize in all the content that you are going to show in the brochure. However, you must bear in mind that it is essential that said title does not exceed 70 characterssince very long name will not bring you very good results.
Research the topic in depth
If you really want to make a good infographic then you need to have sufficient knowledge about the topic that you are going to exhibit, for this you must make a depth investigation about it, taking into account statistics, figures, studies, results, including graphics if necessary, images or videos, with the aim that the reader can clarify all their doubts and correctly understand what is expressed there.
Identify the target you want to inform
This is another of the most important aspects to take into account, it is not the same as your audience is young, adults or childrenaccording to the average age of them should create your content. In the event that it is a adult public you should know if the information should be addressed to engineers, doctors, professors, among others. As Much will depend on this how successful you are.
Be precise and direct
Keep in mind that one infographic is not about a magazine where you have to write and write so that readers spend hours in it. Here it is quite the opposite, in this type of presentations it is necessary to be very precise and direct with what you want to show and explain. For this you must be as direct and clear as possibleconstantly rely on images and graphics when you want to explain something.
proper typography
It is extremely important that you manage suitable typographyin it must be considered both aesthetics such as ease and readability for the reader.
Brand related colors
When choosing the colors these need to go according to your brand, that is, if your brand manages black and white in your infographics also handle both colors. It is best to drive a minimum of 3 colors and maximum of 5 colors, this in order to prevent the presentation from ending up looking like a carnival.
Organize items efficiently
Finally, take care of organize the elements efficiently and by their due importance. The best in these cases is get rid of all secondary and of information that does not generate any type of interest. organize all the topics important in orderas this will greatly facilitate the understanding of the information that you are presenting there.
Web