Index:
UPDATED ✅ Do you want to configure the different chart layout options in PowerPoint presentations? ⭐ ENTER HERE ⭐ and Learn How FROM ZERO!
Charts in PowerPoint slides are very useful toolssince they allow readers to reinforce ideas about data and any other information that is difficult to do through texts.
That is why We have prepared this article for you to know how to configure the layout of the charts in your PowerPoint slides. and what is the best tool you can use, if it is SmartArt or Shapes.
But that’s not all, you can also learn in this post the step by step you will have to do to configure like a professional graphics design.
What should we keep in mind when designing a chart in PowerPoint?
The first thing to keep in mind when design a chart in powerpoint is that you will not be able to do it directly from the program, if you want to include a table that contains different types of data. In this case it will be necessary to use Microsoft Excel that will help you with this task.
On the other hand, if you need to include a graph that is not too complex, you can do it from PowerPoint using intelligent drawings, called SmartArt, Shapes or Graphics that will help you to show bars, areas or lines. Another point to consider is that if you use a table that is related to the graph and you modify its data, the drawing will not change in appearance. It will be convenient to enter the graph on the slide once you have changed all the information you need and you are sure that it will be the final one.
SmartArt or Forma Which is better tool for making graphics?
The difference between a graph SmartArt and a Form is that the first is an intelligent drawing that allows modifications with few steps. That is, you can add data and automatically the distribution of the graph will be changed. Instead, one Shape is a static drawing that has more variety than a SmartArtbut that you will not be able to alter it if you modify the source data.
For this reason, it is convenient to use SmartArt when you know that you can modify the information that generated that graphic and you will have to use a Shape when you have to resort to more specific drawings. You should keep in mind that if you use Smart Art you can turn it into a Shape by going to the tab Designthen clicking on the function Convert and lastly in convert to shapes.
Learn step by step how to set up chart layout in PowerPoint
To configure the chart layout in PowerPoint you will have to do the following steps:
Go to the slide on which you want to insert a chart
The first thing you will have to do is open Microsoft PowerPoint and then create the slides you need. Next, when you want to embed a chart, you’ll need to select slide section clicking on it.
Click on the Insert tab
When you have completed the previous step, you will have to go to the tab Insert and then search, in the options bar the group of tools, Illustrations.
You will find three functions within this group. Which are:
- Shapes: With this type of graph you can include lines, rectangles, basic shapes, arrows, flowcharts, tapes and callouts. You will be able to edit the color of the fill and the borders. You will also have the possibility to choose if you want to insert a text.
- Smart Art: they are smart charts that have a default layout. You will be able to add more elements to them and also edit the borders and fill color. It’s great to work with when you need to give your slides a professional look.
- Graphic: With this type of drawing you can include lines, bars, dispersion area, rectangles, histograms. You will be able to assign them a data label. You work with this type of element when you want to present mathematical, statistical or projection ideas.
Choose the model of the graph

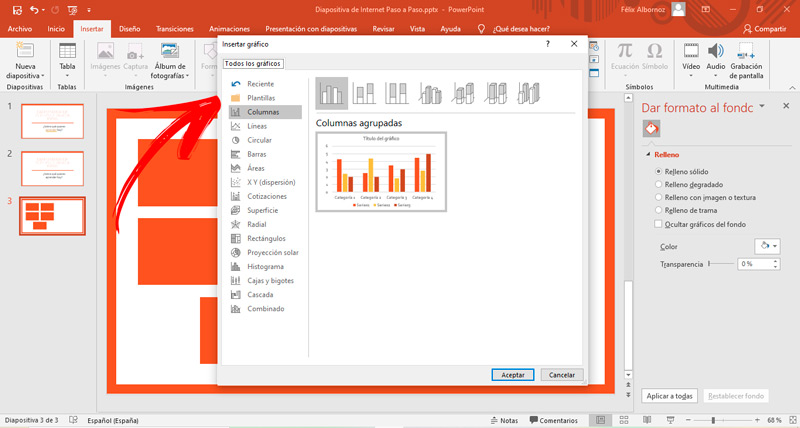
What you will have to do now is choose which will be the function that best suits your work. If you choose the last element that we mentioned in the previous step, Graphicyou will have to press this function and then choose chart type.
Select the style
Once you have clicked on Graph, a window will open in which you will have the possibility to choose what kind of graphics do you want to insert. Click on the one that best suits you and then click on To accept.
Edit the chart on the slide

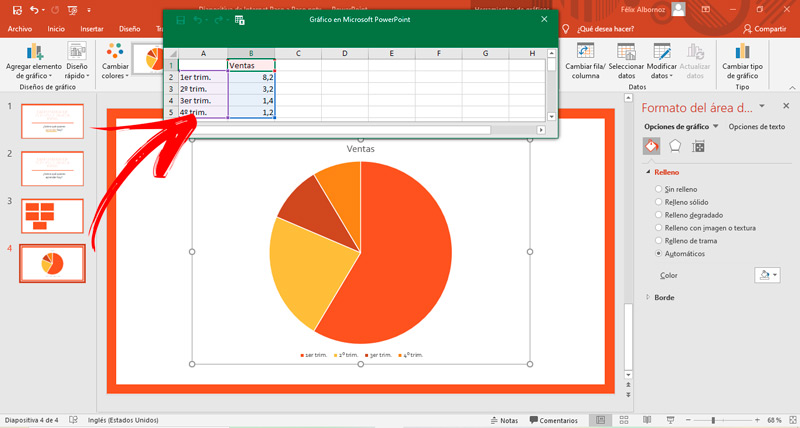
What you will have to do now is edit in the window that will open as a spreadsheet the data you want to enter. When you have finished you will have to close the table and modify the size of the graph by dragging the points that you will find on its edges.
Computing