Index:
UPDATED ✅ Do you want to know how to calculate the statistical variance of a spreadsheet in Excel? ⭐ ENTER HERE ⭐ and learn everything FROM ZERO!
Probability studies that are carried out on samples, or on the total population, when it is necessary to know the dispersion that exists in the data with respect to the halfit is necessary to use the variance to understand the results.
Microsoft Excel has 4 functions that can be applied when studying this type of probability. You must bear in mind that, to use them, you will have to know some previous concepts.
If you want to know everything about how to use variance in Excel and thus be able to determine the degree of dispersion of data with respect to the mean, continue reading this article.
What is variance and what is this value for in statistics?
Statistical variance is the deviation that exists in each datum of a dispersion with respect to its mean, which is measured squared. In other words, this means how far the data is from a dispersion in relation to its mean to determine if there is a large influence near or far from it.
Values are represented in units of measure squared. Therefore, many times it does not make much sense to study this probability variable without establishing a study on the square root of the variance, which is called the typical deviation and the standard deviation.
To understand the variance it is necessary to know what the standard deviation is.. This statistical measure, whose value is equal to 1, measures the degree of dispersion that exists in the data with respect to the mean. Keep in mind that we are talking about the mean and not the average, since they are two different values when this deviation does not have its center at the 0.50 point.
What should we take into consideration when calculating statistical variance in Excel?
As we told you in the previous paragraphs, variance estimates values in units of measure squared. Therefore, in order to understand and interpret a concept of statistical probability, it is necessary to analyze the standard deviation in a context.
This means that, if you are analyzing the population of men between 35 and 45 years old, whose height is greater than 1.80 metersthe variance will return probability results in square meters.
But the standard deviation, which is the square root of the variance, will have a measurement unit of meters, so this type of dispersion should be studied for a better analysis.
Learn step by step how to calculate the variance in an Excel spreadsheet without errors

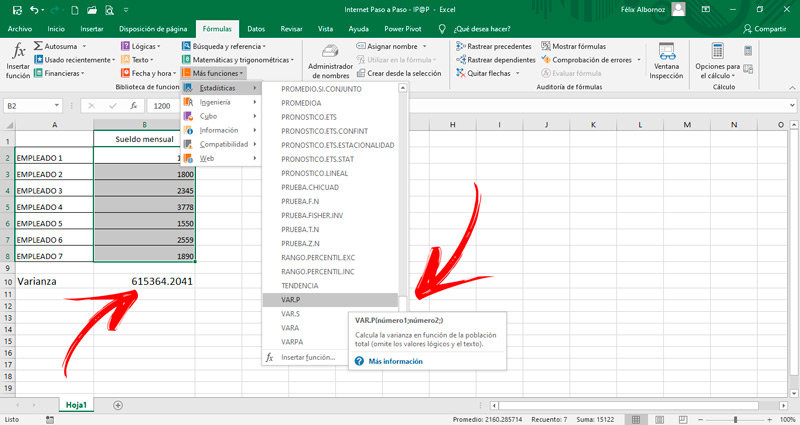
To calculate the variance you must follow these steps:
- Write the population data in a column. Then, in the next column, enter all the data related to each sample.
- Go to the menu “Formulas”.
- Find the group “Function Library” and click on the tool “More Features”.
- Click on “Statistics”.
- find in function “VAR.P” and select it.
- Choose the range of data that is related to the sample and press “Enter”.
In case of have a sample and not the total populationsince you are working with sampling, you will have to use the formula “VAR.S” and follow the same steps that we have mentioned.
If you are working with true and false values in the total of the sample you will have to choose “STICK” as function. But if you have the total of the population data, the function you should use is “VARPA”. In both cases you will have to follow the steps that we have indicated with the formula “VAR.P”.
Computing