
Index:
UPDATED ✅ Do you want to access and interpret the statistics of your Telegram Messenger channel? ⭐ ENTER HERE ⭐ and Learn Everything FROM ZERO ⭐
Have you wondered why Telegram had such a boom in these years? As in all the most chosen apps, Telegram has not been left behind in the update of its Android, iOS and PC versions.
To the use Telegram you will get the easiest way to safely archive your messages and schedule them to send them later. It has become a great competition whatsapp messengernot only because the channelsbut because of the ease of its development for use.
You are going to read how to use Telegram Messenger channels, their importance and their advantages and disadvantages. You will also know about channel statistics.
Why is it important to check the statistics of your Telegram Messenger channel?
The current statistics of the channels is used mostly by people who have more followers, At the beginning of this year 2020, a little more than 1500 subscribers were required, now at the end of the same year it can be used from 50 subscriptions, this is being widely used, to be able to evaluate how the use of its channels is, also for monitor how it is growing of it, if you have more subscribers or if you have increased your performance level.
Telegram is applying it as a key piece of use for many entrepreneurs, and recognized channels, ensuring in this way they will have greater productivity, and will considerably improve the channels, making them progress and increase constantly and quickly. Once this information is obtained, why should we pay attention to the statistics that the application gives us?
The basic foundation is characterized by the fact of seeing that the channels could obtain greater visibility, in the same way to observe the interaction of the subscribers. This would make it easier for us to improve the content of our own channels, mainly because of what we want to transmit to the following public, especially in companies.
Be attentive It will provide us with important data on how we can modify the content that we offer to our followers, making our channel more productive and thus power, create new strategies help it grow. Important added tool Telegram, it could be said that it is a total plus for the application.
Learn step by step how to access the statistics of your Telegram channel from any device
Now that we know how beneficial and useful the statistics imparted by the application of Telegram. We are going to have to learn how you can access it from different digital devices. The first thing to keep in mind is to go to the Store to make Telegram latest updateautomatically It will provide us with new features, resolve previous errors, even simplify processes, and improve message security leading to information privacy.
One time Once the download and its previous installation have been carried out, we continue with the execution of the application, in order to search for the channel that we want to view. Once found, we enter it, showing it on a new screen. Later click on the description of the channel to see the information.
Let’s see how to do it in different systems:
on Android
Being one of the most popular mobile operating systemss used in devices of greater technology and commercial scope, it is necessary to know how they are managed statistics in this open system. We must take into account what has been the growth or some decrease of the company or corporation with which we are working in our Telegram channels.
Go for it:
- The first thing we are going to do is run the application. Telegram.

- Once you see it on screen, we go to the channel of which we are administrators and press on the header of the app, this option it is only available if we have more than 50 subscribers.
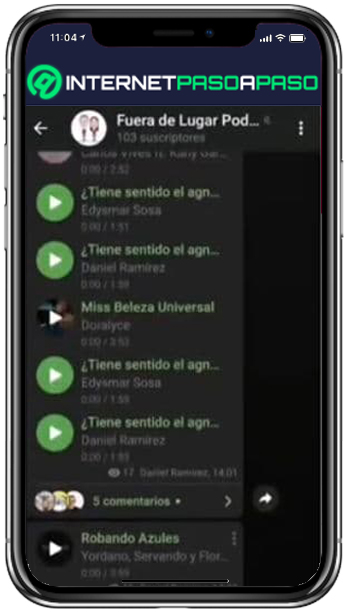
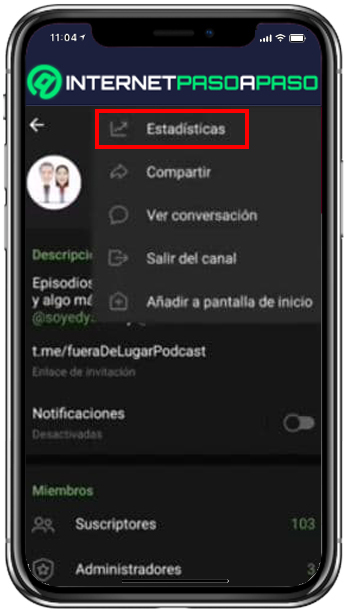
- We go to the three dots that we see in the upper right. The next step leads us to press the first option that says statistics.
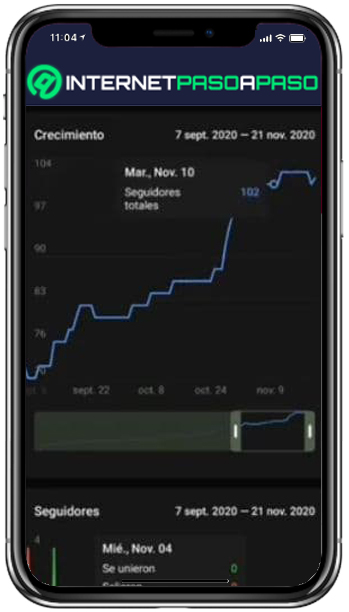
- here we will see the graphics that tell us how our channel is developing.
on iOS
After you have downloaded the app from the App Store, We continue to enter the statistics of the channel. The development is very similar to what is done on computers with Android software.
After the update is finished, we run the app, and go to our channel:
- Next click directly on the channel, but specifically where you get the name, and this will take us to another screen that provide us with the relevant information.
- In the pop-up screen we can see the documentation and files that have been previously sent, also three horizontal dots on the right side of our device.
- Touching the three pointsa next option will appear with a small tab of the options “exit channel” Y “statistics”.
- We’re going to click on the option what does it say statistics, which is what we are interested in learning.
- Therefore we will go directly to see the graphs that contain the information what we long to know.
On PC and macOS
The special version of Telegram for desktop It is one of the most used for its quality of messaging and facilities that it has, is considered one of the most complete that exists. The first thing to do is install the app on the PC, depending on the operating system used, which can be Windows, Linux or even GNU, follow the download instructions and continue to run it. How can we see the statistics of the app on the PC?
The first thing to keep in mind is that the application can work independently And the best thing is that it works the same way as it does on a phone device, be it Android or iOS. It is not bound to work like other messaging apps. Example: WhatsApp. And when you enter, you can see on the left side the place of the chats or channels.
Though it has almost the same functions as in the other devicesit also has some disadvantages, one of them is not being able to send photos through the PC camera, send private messages or calls “secrets”, be able to send the current location, and have two accounts active at the same time. The rest from there are pure advantages.
We teach you from scratch what are all the statistics that you can see on your channel and how to interpret them
After have entered our channel, and go through all the previous steps already mentioned, we go to explain how statistics can be useful according to its interpretation, and function.
Keep in mind that all the graphs are structured with the following sections:
- Start with the name of the graph in the upper left.
- Date range located in the upper right.
- Graph: On the axis (x) dates are displayed and on axis (Y) the quantitative value of the configuration.
Weekly report
- is the first stat What we can see, there is a very interesting weekly report. The first section of the summary of the last week is exposed, in which the following data is shown ordered by two columns.
- In the first column aligned on the left side the number of current followers (green color) is displayed, followed by small numbers (in red), the number of subscribers that have been added or unlinked from the channelafter that you can detail the percentage ration of increase or decrease of these, so that if the value is positive it indicates that there was an increase in followers.
- Next to this is shown the number of views per post sent in the channel, indicating its percentage amount.
- Example: if the value is positive there was an increase in views per post, in the case of a negative value the percentage that has decreased is shown.
- In the right column we can see other data such as the users who have the channel active notifications. And then we can see the percentage of users who have forwarded post in that week.
channel growth
- The section begins with the name of the graph “Increase”, In addition, a custom date range is displayed. It will look like a linear graph.
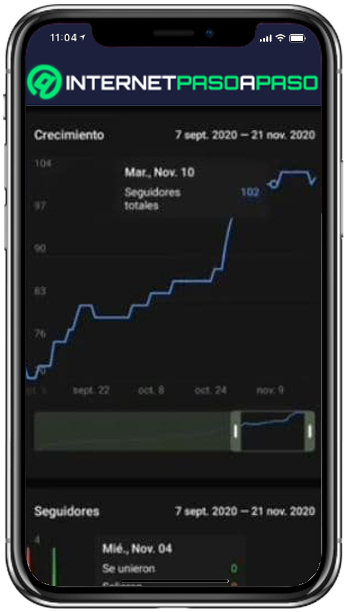
- In the x axis (x) dates are displayed by ranges, and on the (Y) axis The number of followers is displayed.
- After the graph at the bottom shows a range component that pressing it in the center, you can slide within the limits of it. You can even increase or decrease its size, causing the graph to adapt to the new parameters assigned, which are the start date and the end date.
- Keep in mind that pressing inside the graph we can see a small box that provides us with the information of the total number of followers on the selected date.
followers
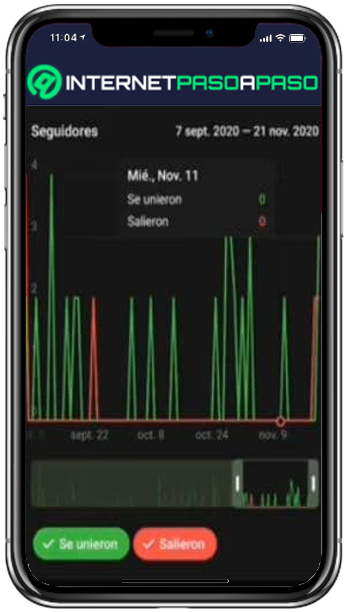
- Now for this graph, we will observe that the number of followers who subscribed or left per day is shown.

- At the bottom are shown two options button-shaped, the first of green color indicates “joined”, and the red color shows who “got out”. Initially these two options are active, but their status can change, keeping one or the other active.
- After this, a small box that gives us the specification of who left and who entered on the corresponding date.
Notifications
It is very similar to that of “followers”, nevertheless you have the option to toggle the options between muted and unmuted. It works to keep track of showing which followers have or have not muted notifications. As an advantage, we will know which subscribers are comfortable with the notifications sent, how many like it and how many prefer to keep it more distant.
traffic sources
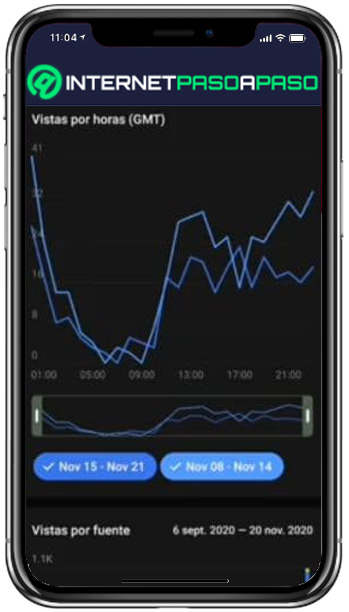
In this we can get we are shown the hourly views of the last two weeksis also added the amount of traffic from active people on the channel, and below the graph we can see the two date options that can be modified at will, from the beginning of the week to the end.
In addition to this we can see at what time the subscribers they have preference to be in the channel. This graph usually comes in blue and double or it can even be left on a single line, which has the facility that it can be modified according to personal criteria.
The advantage of knowing how to read this graph is that It will help us publish content more often in the hours with the highest income to the channel in order to increase the views of it. And it keeps us attentive to the dates in which the contents were most accepted by subscribers, obtaining greater activity.
Sources of followers
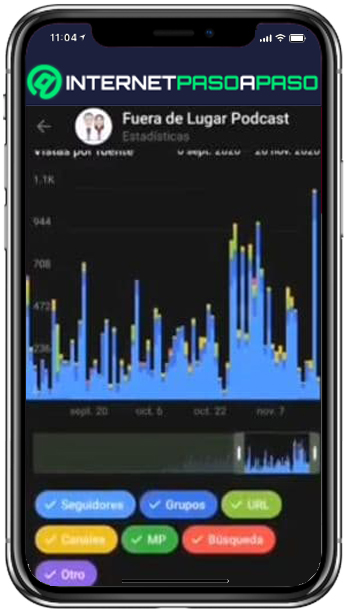
Is another one type of bar graph with a very interesting statistic, since it provides us with very important information, because it tells us where our followers are reading us from, that is, it gives us in a simple way where several followers visited us.
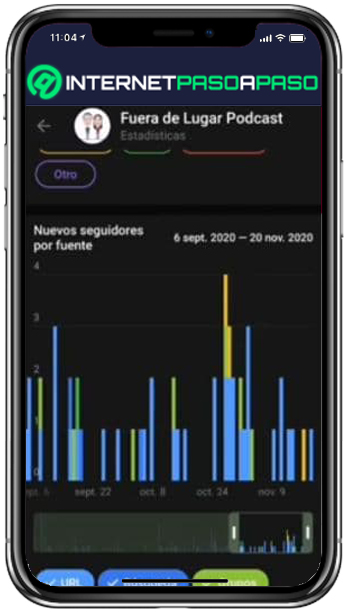
Example:
- It groups us by day and weekhow many came through a group.
- What amount I arrive by a shared URL address.
- Channels or referrals.
- They arrived by means of a private message search or others.
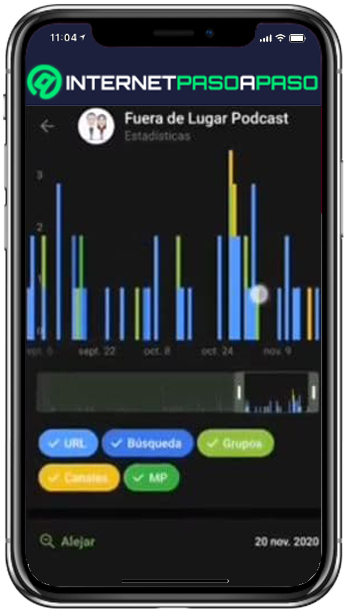
It has the advantage that can be moved and used by dates, threshold or range bar that is at the bottom of the graph has that function. The other advantage is that it is easy to select which group I already mentioned I want to see.
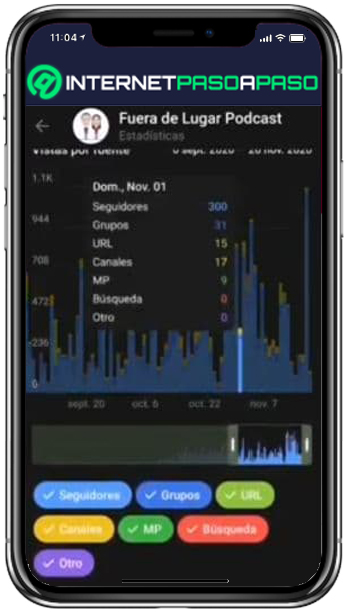
Example: if only I want to see the statistics of the people who entered by a URL address, what must be done is to select the small bar of the corresponding color and what is required will appear in the graph in a personalized way.
In the same way if I want view the followers who entered by a group, or by private messages, and all the other options. It is important to note that to select one, I must turn off or press the button on the others in deselect mode. Here too we can see the new list of followers but for each group mentioned before, which is a plus to be able to know the entries with the highest flow of views and thus create our own route.
language graph
- Further down we can see another graph in a round shape, which will indicate the language used by the subscribers of the channel, so that it will be easy to interpret the percentage.
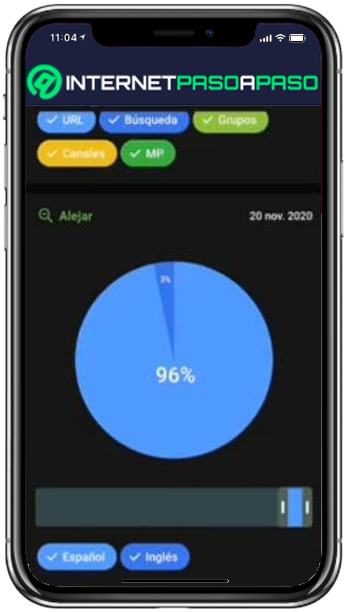
- Example: 90% in Spanish, 10% in English. Then in the lower part of that graph, we will see a large blue box that will quantify how many subscribers have Spanish, English or other existing languages in their Telegram configuration.
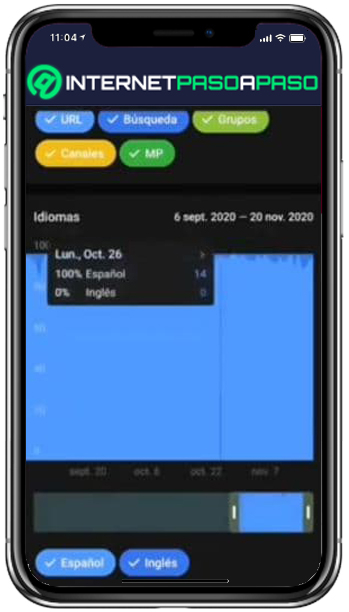
- And in the lower range bar it can be moved from side to side to indicate the date we want to review.
Interactions
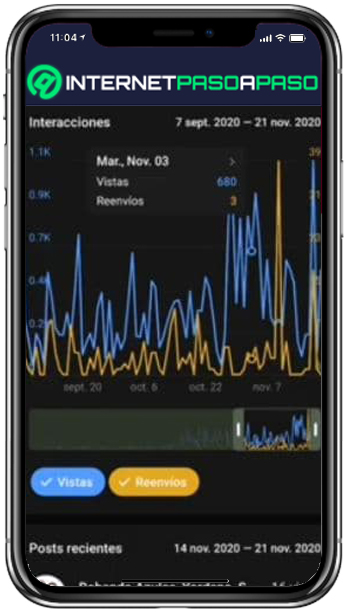
- This linear graph, It will indicate how many have seen some of the posts sent, and how many have shared or forwarded said posts. In the same way as in other graphs, the threshold that remains in the lower part will help us to enlarge what we want to observe for days or weeks.
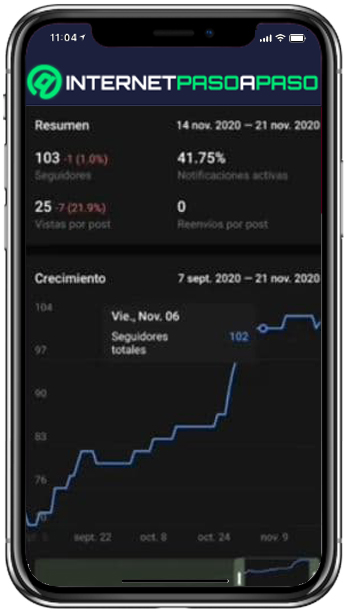
- And finally the last one will be manifested statistics of the posts recently sent in the week.
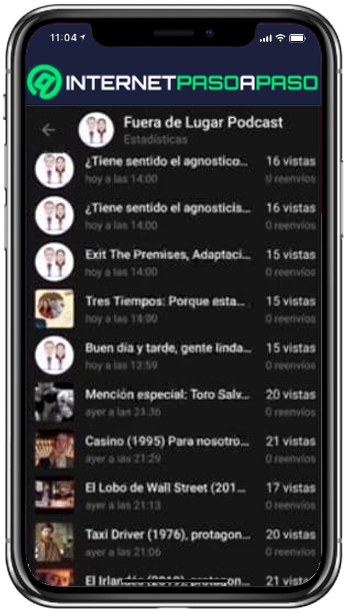
We are going to be shown per post, how many views each of them has come to have; This is displayed in a long list where we can see each one individually, which gives us the advantage of seeing which topic is preferred by each subscriber.
Applications