
Index:
UPDATED ✅ Want to insert a grouped report from other reports in Microsoft Access? ⭐ ENTER HERE ⭐ and Learn Everything FROM ZERO!
East Microsoft software It is mainly characterized by offering a large number of tools and functions that facilitate work on it, especially in those cases when you have to work with a large amount of data. It is because of that apply reporting tools It will always be of great help to you.
And it is that the reports have become a way to view, summarize, and format all the information that appears in the database. This means that at the time of apply these functions the user has the possibility to work only with the data you really need.
In this way, this tool becomes of great help when you want to work with phone numbers of specific contacts or sales by regionsince it simply allows see the data that really matters. Considering the importance of summary or grouped reports in Accesshere we are going to teach you a little more about it and how to create them in your databasefor this, follow in detail everything that we will teach you below.
What is a summary report and what is it for in an Access database?
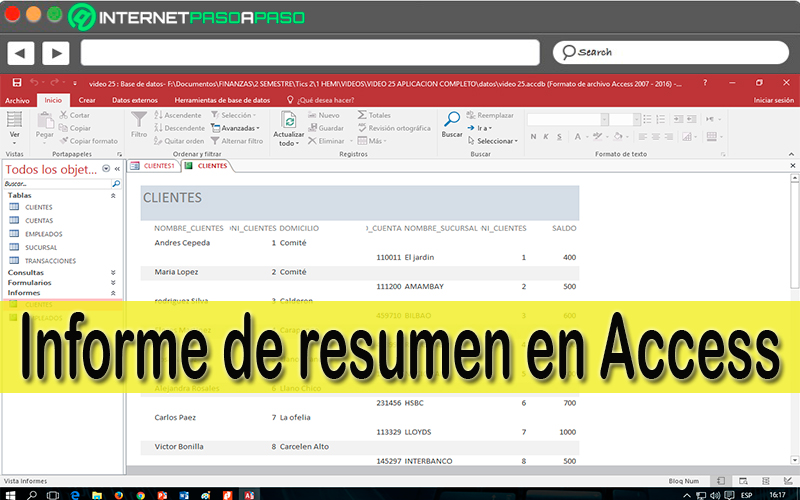
when they apply summary reports in a database the information that is contained there is long ago easier to understandespecially since this is divided into groups. This means that if it is a report where the data is grouped by sales in different regions, It can highlight trends that in other regions will go unnoticed.
When they work with totals such as general averages or sums at the end of each of the groups, then you can end up getting these values as results without having to do use of calculator. According to the importance of being able to work with grouped reports, Access offers different ways of be able to apply them in your worksheet which we will explain later.
What should we take into account before creating a grouped report in Access?
You must take into account that at the time of create these reports in Access you will get more ease work with the data that you have inserted there.
And it is that they are a very useful alternative to be able to present information within a database when you want to obtain specific purposes such as the following:
- To create labels.
- file data snapshots.
- To show or distribute a summary of the inserted data.
- Contribute details about a specific record in the table.
Furthermore, it should be mentioned that these reports are much easier to create when the database is made up of a table structure Y well designed relationshipsThis, without a doubt, makes this whole process easier.
Learn step by step how to create a grouped report in a Microsoft Access database
As mentioned earlier in the post, Access offers different alternatives to be able to create a grouped report in a database and thus facilitate even more understanding and work on the program. So here we show you the three ways you have available to create a report.
To do this, follow in detail each of the methods that we will teach you below:
manually
The first method that we will teach you is to carry out this procedure of manually, it doesn’t matter if you don’t have any type of knowledge or experience to apply this tool since it is a very simple and quick procedure to execute.
To do this, follow each of the steps that we will teach you below:
- In the Access navigation pane you must choose a table or query that contains log data with whom you want to work on it
- Next, click on the tab “To create” and then in the option “Report”.
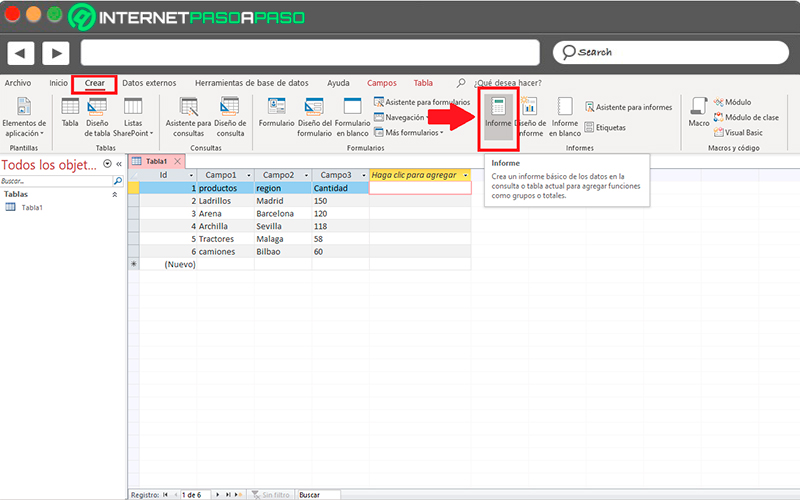
- After that Access will automatically create a tabular report and teach it in the presentation view. In the event that the report contains too many fields, it will most likely extend over more than one page.
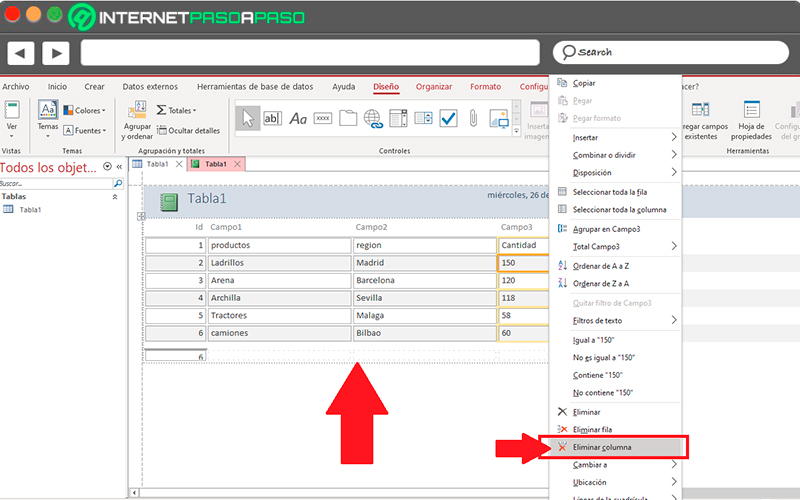
- Before wanting to apply a sorting or grouping you must bear in mind that it is possible that you want resize columnsas well as delete some you don’t want, this will help you make all of this fit to the width of a page. If you want to delete a column you must right click on the column and there you select the option “Delete column”.
- Now you must right click again but this time on that column where you want group or sort the datawhen you right click you will see a dropdown menuthere you must select the item of “Group on field name”, so you can understand this better, if you click on the column of “Field 1” then in the drop down menu you will find the option to “Group in field 1”.
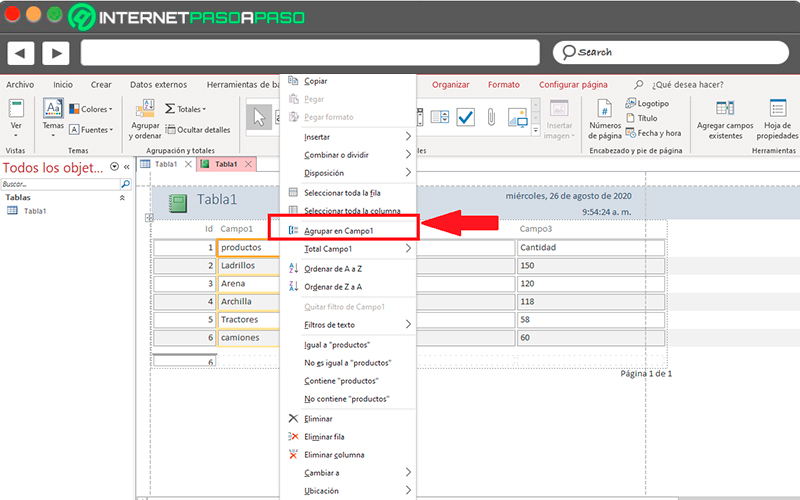
- When this grouping is applied, the program moves the field of grouping to leftmost column and then group the remaining columns. On some occasions also a grand total is added to the footer section of the report.
- finally and of optional form, you can go to the grouping and sorting options settings and there you can add or modify the grouping and sorting of an existing report.
with the assistant
another way to power create the grouped reports is through the wizardthis wizard usually generates a series of questions and then create a report based on each of the answers that have been given. Some of the questions shown here are the number of fields that you want to use to group the report.
When all this has been created, it can be use as is or you can modify it if you wish. It should also be mentioned that before start the wizard it is necessary to choose the data source.
To carry out the execution of this method it will be necessary to follow each of these steps:
Start the report wizard in Access
- The first thing will be to go to the tab of “To create” and then to the section “Report” and there you select the option Report Wizard.
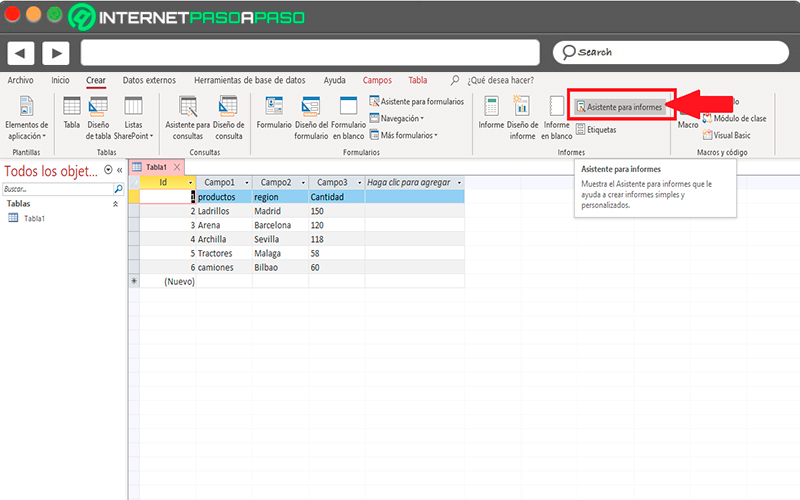
- It will then start the Report Wizard.
- Now you must select the dropdown list of “Tables and Queries” and there choose table or query where the data you want to include in the report is located.
- Here you must select the fields from the list “Fields available” to be able to choose them.
- The program will start moving the fields to the list of “Selected Fields” and in the same way you can click on the buttons that are located in the box “Field available” and in “Selected Fields” so that these are added or removed.
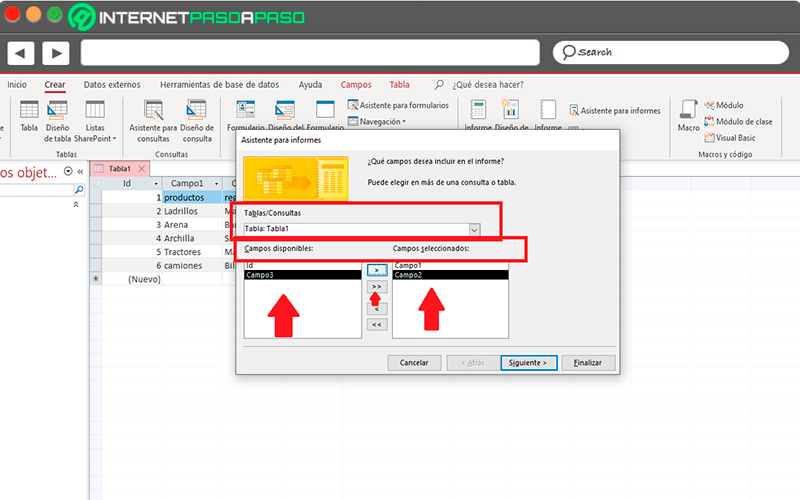
- If for some reason there is another table that contains fields that you want to include in the report, then you need to select the drop down list “Table and query” and there you choose the other table that contains the fields you want to add.
- Click on “Following” once you have finished adding all the fields.
Group the records in the wizard
Being able to do the grouping of records will allow you to organize them by groups, this will depend on what treat the databut for example it could be by regions or by seller. These groups allow more easily identify regions between groups and in this way get the necessary information with greater ease.
These groupings also make it easier to obtain the summary information or to calculate percentages and totals. Now if the report has been constituted by more than one tablethen the wizard will take care of performing a relationship between tables to determine how you can present the user with information.
To do this you need to follow these steps:
- On the report wizard page where you are asked Do you want to add some level of grouping? You must select one of the field names in the list and then click “Following”.
- if desired add grouping levelsyou must double-click on any of the field names from the list to add to the report.
- In the same way it you can delete or remove a level of grouping, To do this, click on the level on the page to the right of the dialog. With the help of the arrow buttons you can add or remove grouping levels and in the same way adjust the priority of a grouping level by selecting and clicking the button “Priority”.
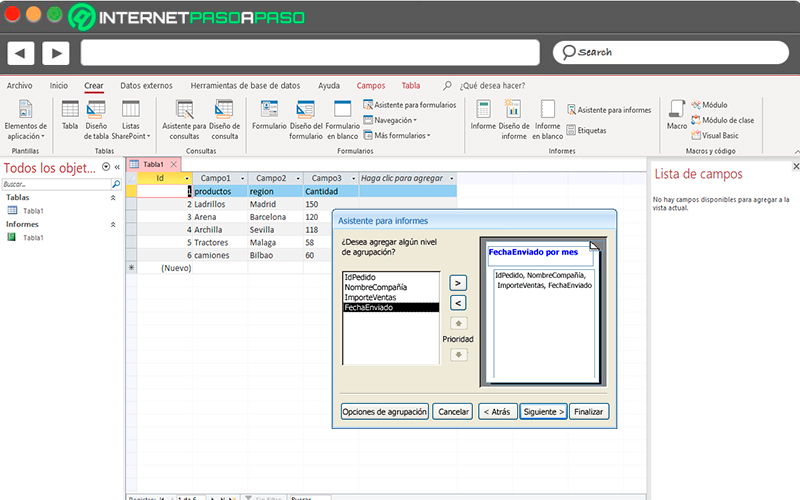
- Now you must click on the section of “Group Options” and there you will see the window “Group Intervals”.
- Here you can choose for each field of group level a grouping interval. These ranges allow you to customize how the group the records.
- The assistants in these cases offer different options in the list of “Group intervals” some of them are the dateand in it you can get what is the “Year, Quarter, Week, Month, Day, Hour, Minutes”.
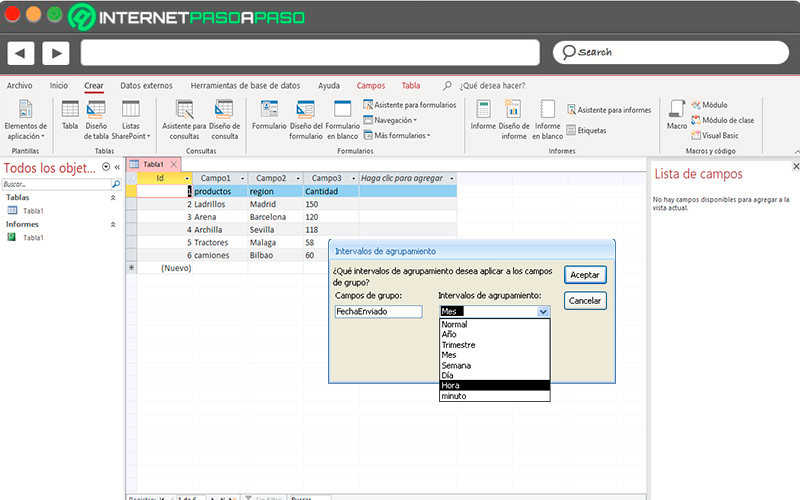
- Once the type of interval has been defined and selected, you must click on “To accept” and then in “Following” to end this procedure.
Modify grouped reports
Finally, if you already have a grouped report created and you want to order or group or modify it, then you will need to follow each of the steps that we are going to explain below:
Add groupings, sorting, and totals
Here you can carry out very simple processes of groupings, creating totals and sorting, where simply by right-clicking on the fields in the presentation view and selecting each of the actions that you want to perform in the drop-down menu that appears on the screen. if you want to change the presentation view you must click on the secondary button on the name of the report and there click on “Presentation view”.
Taking all this into account, the following will be to perform these steps:
- From the tab of “Design” you should go to the section “Group and Totals” and then select the item “Group and order”.
Sort by a single field
To be able to order the fields in this way it is necessary to follow these steps:
- The first thing to do right click on any of the values of the field you want to sort.
- Now in the drop-down menu that appears there you must select the option of “Ordination” you want. In this case you will find the options of “Sort from A to Z”, “Sort from Z to A”, if you want to sort numerical fields then you must click on the option “Order from largest to smallest.”
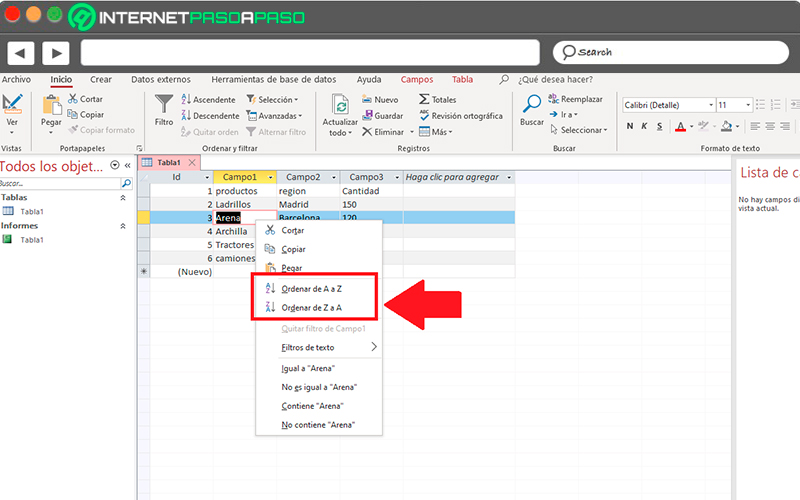
In this case the program will start sorting the fields according to the parameters that have been specified. If the panel is open “Group, order and total” then you can see a new line has been added “Sort by” for the field.
Sort multiple fields
In these cases when apply the sort order by right clicking on one of database fields, only one field can be sorted at a time. if applicable sorting to another fieldthen the sort order of the first field is removed.
At this point the sort behavior is different in forms, this is where they are set different sort criteria by right-clicking on each of the fields and in turn selecting the ordering criteria that you want.
Group in a field
- In this case, right click on any of the the values of the field that you want to group.
- Now in the context menu you must select the option “Group on”.
The Access system will take care of add grouping level and in turn creates a group header for that level. If the dashboard is started “Group, Order and Total” then you can see how a new line has been added “Group in” for the field.
Add a total to a field
With this option you will have the opportunity to calculate what is an average, a sum or a count. For this, a general total is added at the end of the report and all group totals.
To do this, follow these steps that we will teach you below:
- To start you must right click again on any of the the fields you want to calculate the total for.
- Next select the item from “total”.
- Now you must click on the mathematical operation you want to perform, either “Sum, Average, Include Records, Include Values, Standard Deviation, Variance, Min, Max”.
Here the program will take care of add a control over the calculated text box at the bottom of the reporte, in which a grand total is created. If the report has a grouping levelthen add group feet and place the total in each foot.
Add a grouping, sorting, and totals using the grouping, sorting, and total panel.
panel “Group, order and total” is the one who provides the most flexibility when you want modify any of the grouping report options, and in turn when making changes to the order criteria and totals of a report. When working with these reports it is usually done from the presentation viewsince it offers greater comfort and it is much easier to be able to see how the changes affect the presentation of the data.
In order to display this panel it is necessary to follow each of these steps:
- From the tab of “Design” you should go to the section “Group and totals” and there you choose the option “Group and order”.
- Next Access shows the panel “Group, order and total”.
- In order to add a new ordering or grouping level, you need to click on “Add a group” or “Add an order”.
- Here a new line should be added to the panel “Group, order and total” and a list of available fields is displayed.
- You can also click on field name or expression below the field list to type an expression. When an expression has been written or a field has been selected, the program adds the grouping level to the report. In the presentation view this will switch automatically and the sort order or grouping is displayed.
Eliminate grouping and sorting levels
Finally, we find what is the elimination of a grouping or sorting level. To do this, you need to click on the row you want to delete in the control panel. “Group, order and total” and then you must press the key “Suppress” on your keyboard or right click and select the option “Remove” in the dropdown menu.
At the time of remove a grouping levelif said field was group header or footer, Microsoft Access moves it to the section “Report Details” and all controls included in the group footer or header are removed.
Software